One of the biggest challenges we have when it comes to big data is how to effectively join multiple pools of data together to help inform marketing and business decisions.
Some data naturally fits together, like Google Analytics and Google Ads. But not all streams align perfectly, like email and customer relationship manager (CRM) data. This is where data aggregation comes in to play.
What is data aggregation?
Data aggregation is the method of pulling data together from several sources to paint a clear picture of your marketing and business performance.
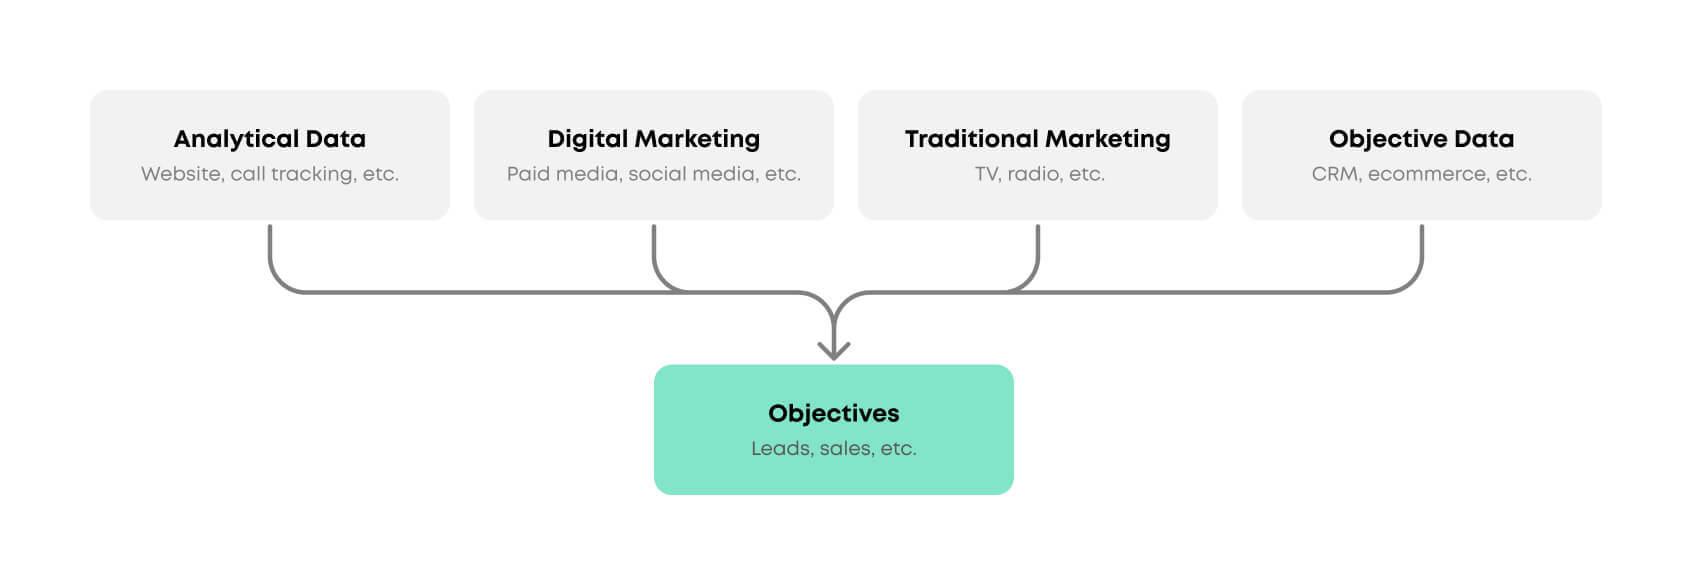
Here’s a simple representation of the various data sources that can help marketers understand performance and how it contributes to objectives:

Aggregation at this level shows you how your activity works towards an objective, but it doesn’t always show the actual impact.
Let’s say you look at how many people completed a form on your website. Google Analytics provides this as well as supporting information such as where the user came from (i.e. paid media, social, etc.). However, it doesn’t show you what happens after they submit the form.
Now let’s say we need to understand performance after a user has completed an action. If a user finds the website and completes a lead generation form, we can identify where they came from, what they did on the website and the form they completed. But if we want to see if they subscribe to a service to find the value of the customer, there is a disconnect.

This is where data aggregation across platforms is essential. It lets you tie a fully converted user (in this case, a user becoming a paid subscriber) back to the source which helps you easily identify the real value of marketing.
There are many cases where the data may not fit into that model or have no direct correlation. This can include TV ads, CRM lead statuses and even physical store interactions. To better understand this, you can employ data modelling.
What is data aggregation modelling?
Before you can aggregate data, you need to understand what you have available and what story you need it to tell. Modelling data can help you see where it fits in the funnel while also identifying connections between the data sets and ways it can tell a collective story.
Data modelling helps you easily link all the data together and provide a unified view of data sets. For example data modelling can help you track a telephone number through a call tracking platform and into a CRM, or track a sales number between Google Analytics and the sales system.
Despite this, many points may not be straightforward to track through the user’s journey. For example, it can be difficult to know which website users convert to a service subscriber. We can’t typically track the lead nurturing journey, so we have no way of truly understanding how many users become paid subscribers.
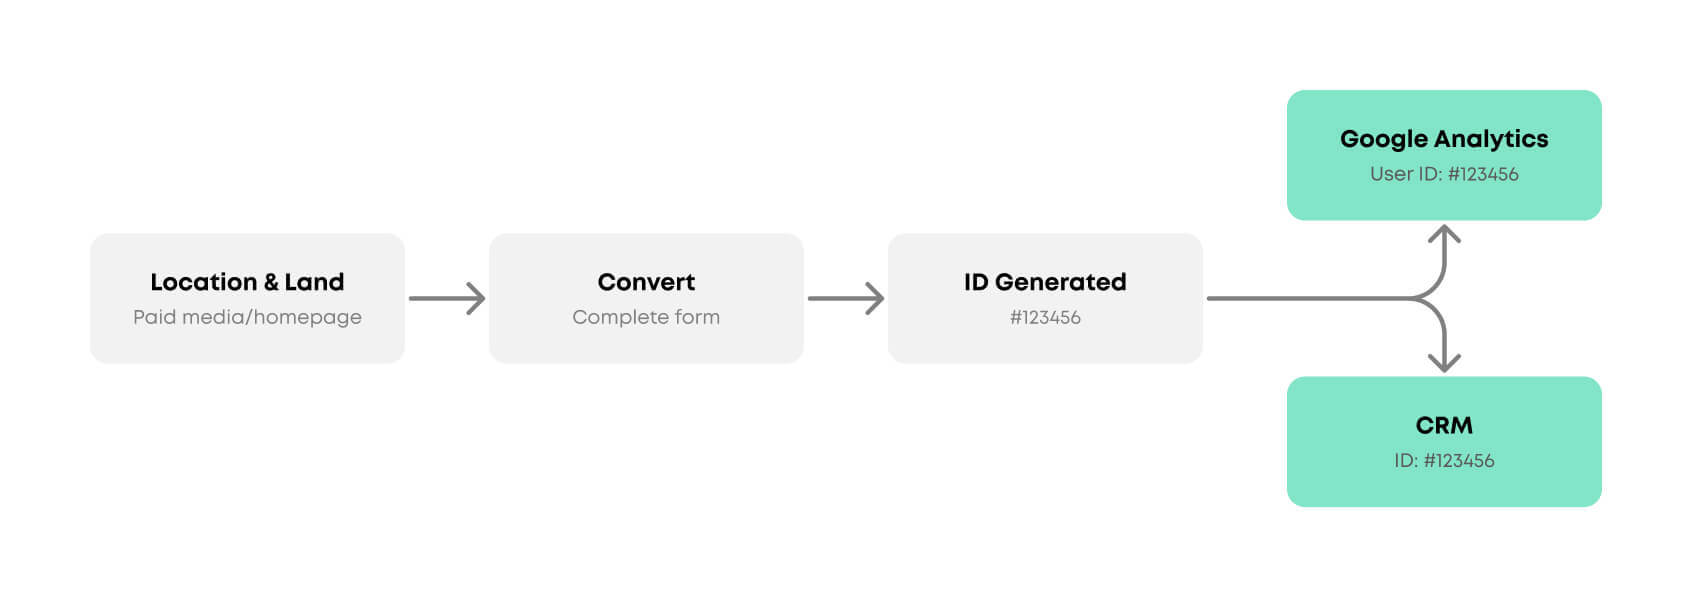
To get around this, we could create a unique identifier that passes to Google Analytics and the CRM once the form is completed. You can then use data aggregation to track the lead status back through the user journey.
Here’s how that could look:

Why is data aggregation important?
By aggregating and modelling your data, you’re taking critical steps towards achieving the best outcome that reaches your objectives. In most cases, this will be something such as return on investment, or measurement to establish your actual financial return after the cost of marketing and other expenses.
By comparing and understanding your most affective channels, you can have a better understanding of where to direct your budget.
For example:
- Imagine you are offering a service and a customer comes to the website
- They enter the site via a paid search ad with an average cost per click of £10
- They complete the registration and subscribe to the service for 12 months, worth £1200
In this example, the aggregation is easy to attribute through the journey and identify return on investment. All parts of this journey are tracked online.
But what if it’s a complex journey:
- A potential customer visits your website via a paid media ad with an average cost per click of £10
- They complete and submit a lead generation form for review
- Following a review, you issue the potential customer with a bespoke quote<
- The potential customer accepts the quote and completes the registration, paying £1200 for 12 months service
In this example, you can directly track users up to step two, after which the data is stored in a separate system like a CRM. In this case, you can’t directly attribute the completed registration to the journey, which means you can’t work out the overall return on investment.
By aggregating all the data points, we can identify the source of traffic and see how they progress through the customer journey. In turn, that helps us understand the actual value of the marketing activity.
This is particularly useful if you’re using two similar sources and want to understand which provides the most value.
Let’s imagine that you’re using Google AdWords and LinkedIn advertising. AdWords is generating 100 leads and LinkedIn is generating 50, both with an estimated cost per lead of £5. At this point, Google AdWords looks like your best channel overall as it’s generating more leads.
But once we aggregate the data, we see that 1 in 10 Google AdWords’ leads and 3 in 10 LinkedIn leads turns into a conversion.
This shows that LinkedIn is more profitable despite generating fewer leads.
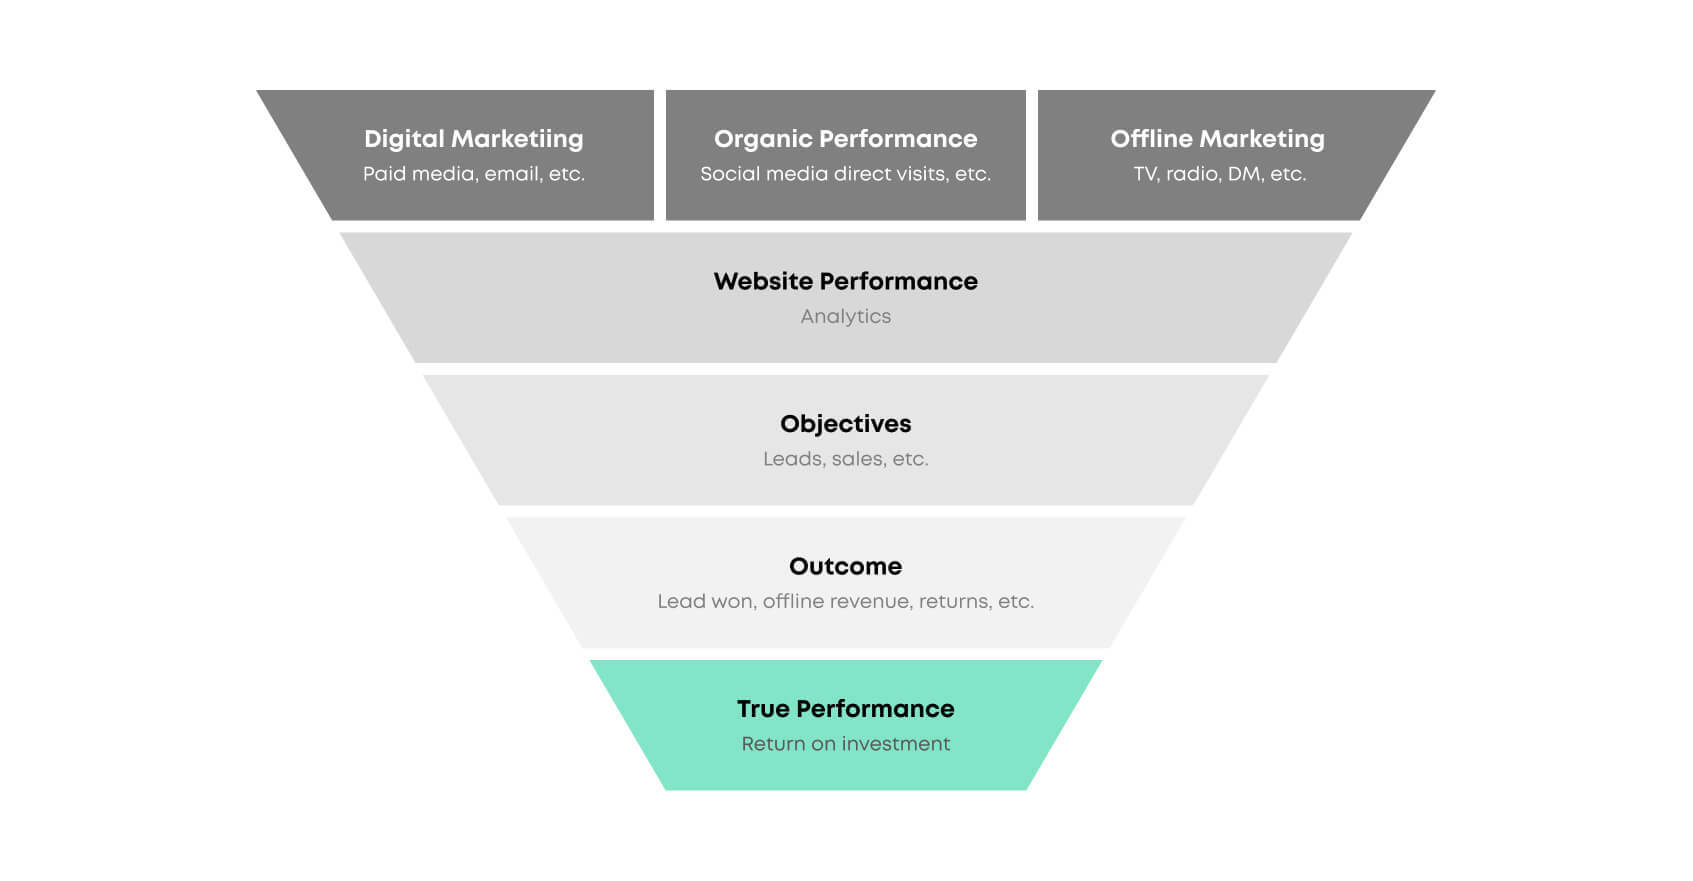
Example aggregated funnel

Aggregation helps you understand the value of your marketing
Data aggregation means you can tie all performance back to your marketing activity and make improved marketing and business decisions
Putting this process in place at the start of your marketing activity will help you make informed decisions from the get-go.


